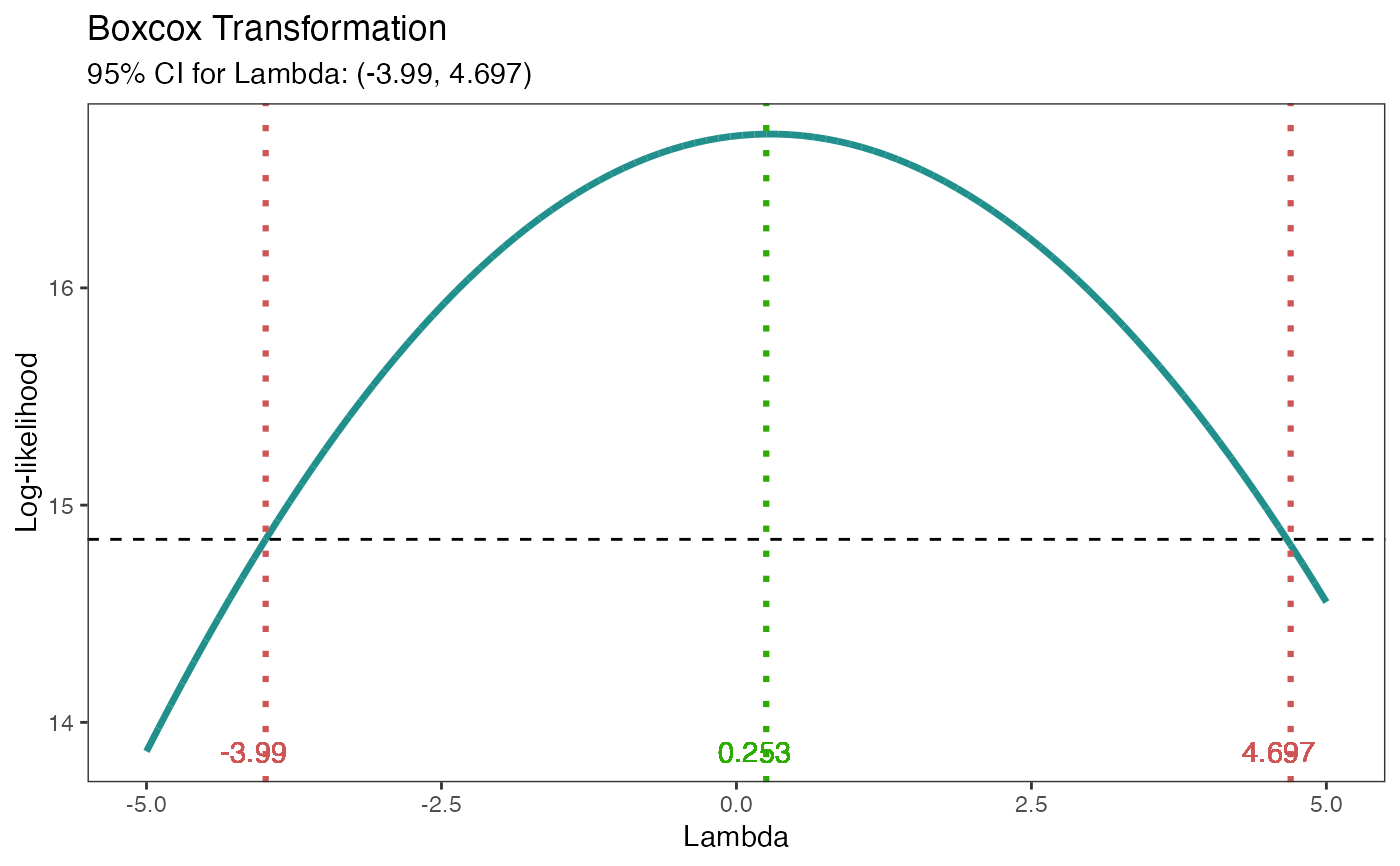
Box-Cox Transformations
Usage
boxcox_transform(
  model,
  lambda = seq(-2, 2, 1/10),
  showlambda = TRUE,
  lambdaSF = 3,
  showplot = TRUE
)
Arguments
- model
Model used for Box-Cox transformation
- lambda
sequence of lambda values to consider for plot. Default is seq(-2,2,1/10)
- showlambda
Default is TRUE, show lambda values in plot
- lambdaSF
Digits to round lambda values shown in plot
- showplot
Default is TRUE, if false plot will not be shown and a tibble is returned with a 95% confidence interval for lambda and lambda value which maximizes log-likelihood

