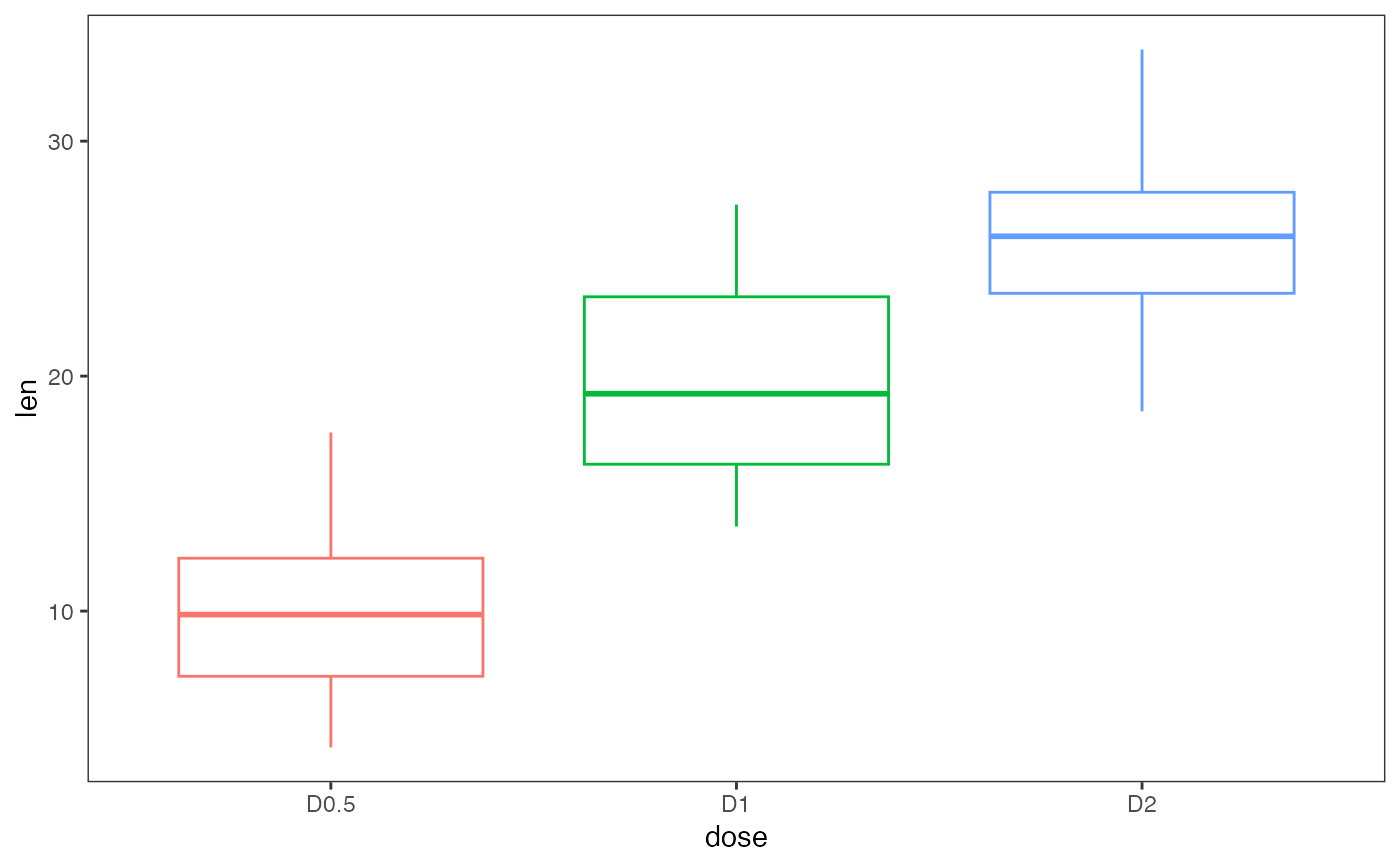
Boxplots using ggplot2
Usage
gg_boxplots(
data,
x,
y,
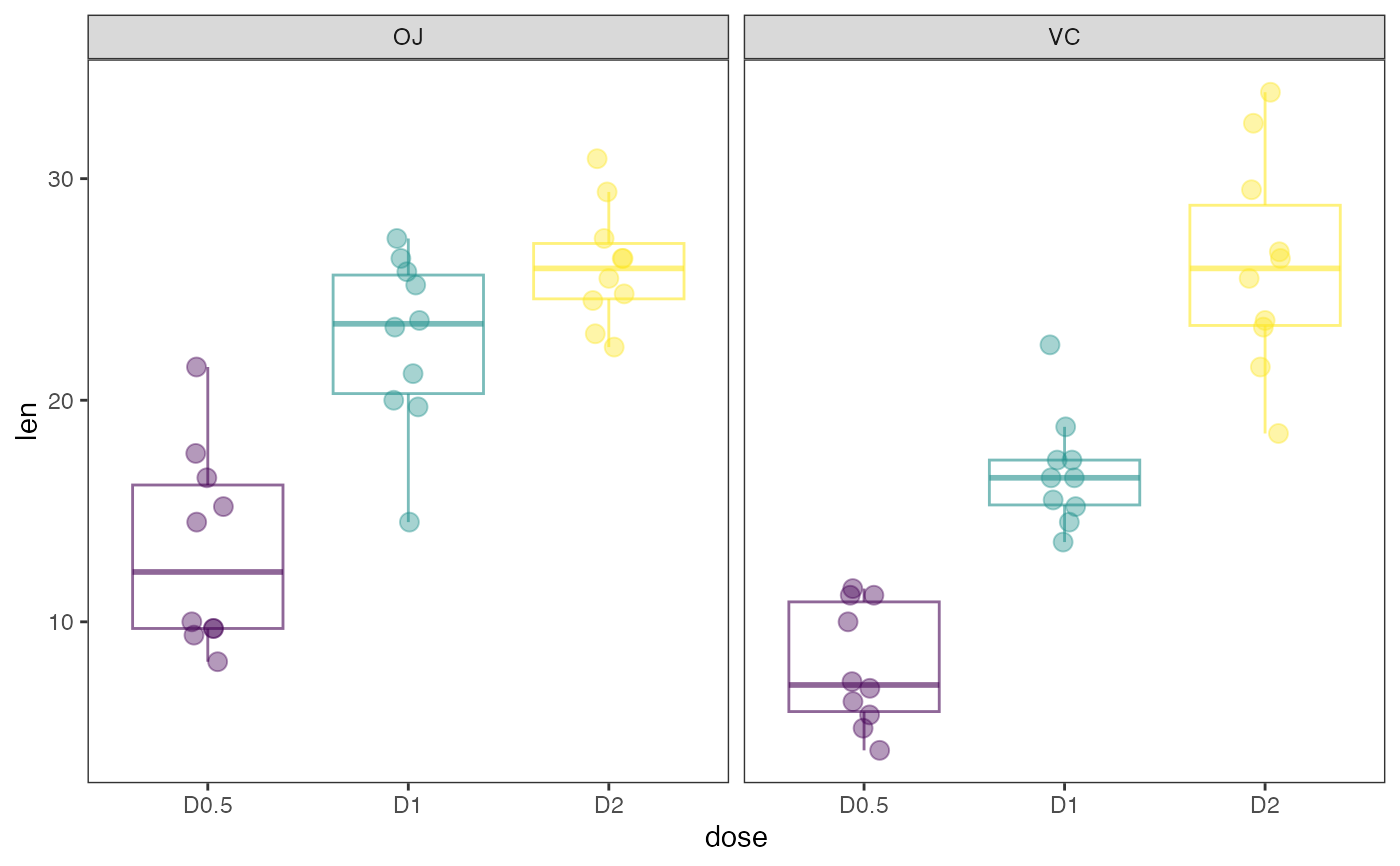
group_var = NULL,
jitter_points = FALSE,
horizontal = FALSE,
point_size = 1,
alpha = 1,
color_palette = NA,
direction = 1,
show_mean = FALSE
)Arguments
- data
provided dataset
- x
A character string indicating the factor of the data
- y
A character string indicating the response of the data
- group_var
A character string indicating the groups for facet_wrap
- jitter_points
Overlay jittered points to boxplots. Default is FALSE.
- horizontal
Determine whether to change the orientation of the plot. Default is FALSE
- point_size
Change size of points (outliers) in boxplots
- alpha
The alpha transparency, a number in [0,1]
- color_palette
A character string indicating the color map option to use. Eight options are available: "viridis","cividis","magma","inferno","plasma","rocket","mako","turbo"
- direction
Sets the order of colors in the scale. If 1, the default, colors are ordered from darkest to lightest. If -1, the order of colors is reversed
- show_mean
Display the mean for each boxplot. Default is FALSE