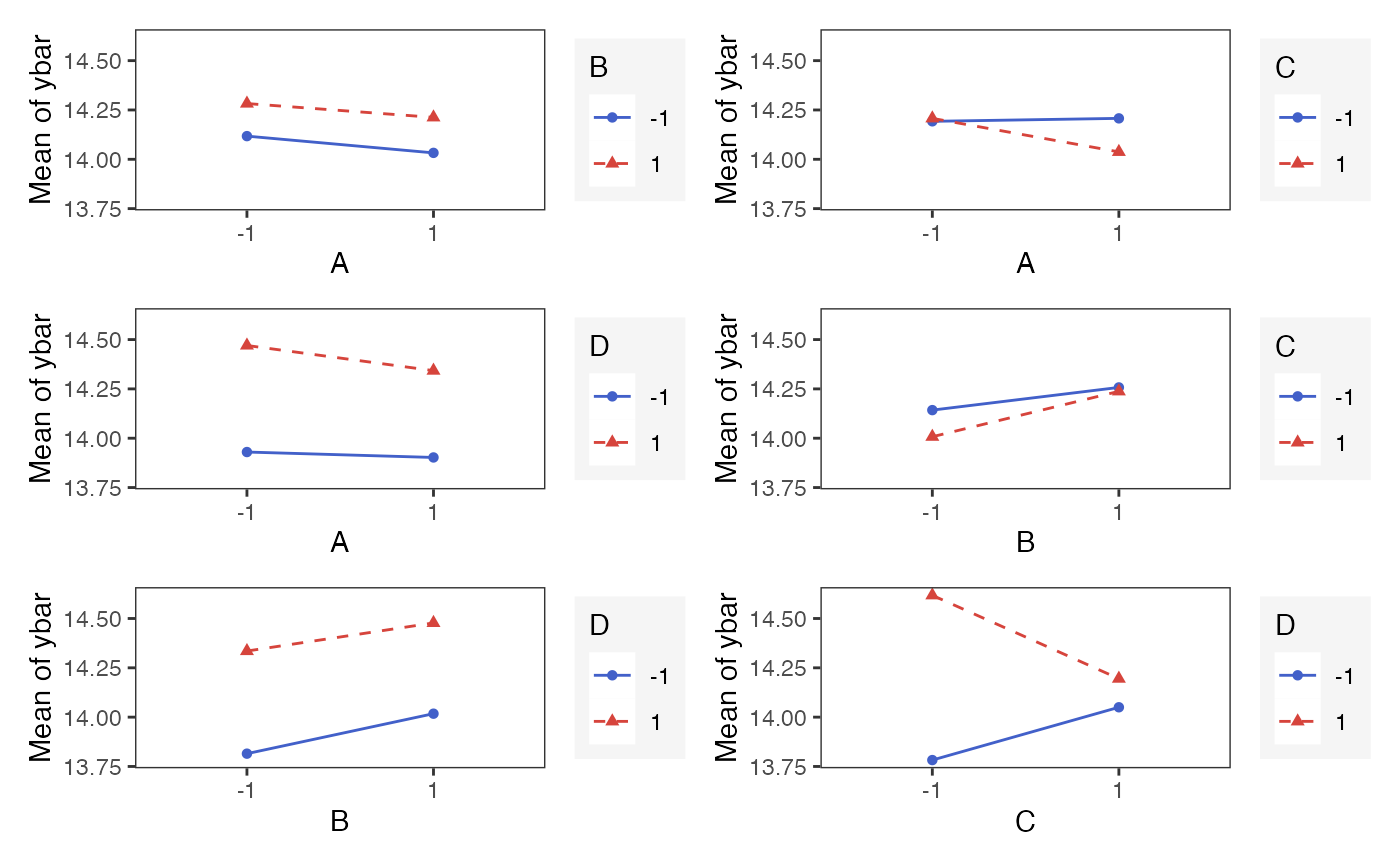
Two-Factor interaction effects plot for a factorial design
Source:R/interaction_effects.R
interaction_effects.RdTwo-Factor interaction effects plot for a factorial design
Arguments
- design
Design of experiment (Factorial Design)
- response
A character string indicating the response of the data
- exclude_vars
A vector containing variables to exclude
- linetypes
Change linetypes. Default are ('solid','dashed)
- colors
Change color of lines/points. Default are ("#4260c9" ,"#d6443c")
- n_columns
number of columns for facet grid. Default is 2
- showplot
logical indicating to show the interaction effect plots. If false, a list of tibbles is returned used to obtain the interaction effects for each factor. Default is TRUE
Examples
interaction_effects(adapted_epitaxial,response = 'ybar',exclude_vars = c('s2','lns2'))