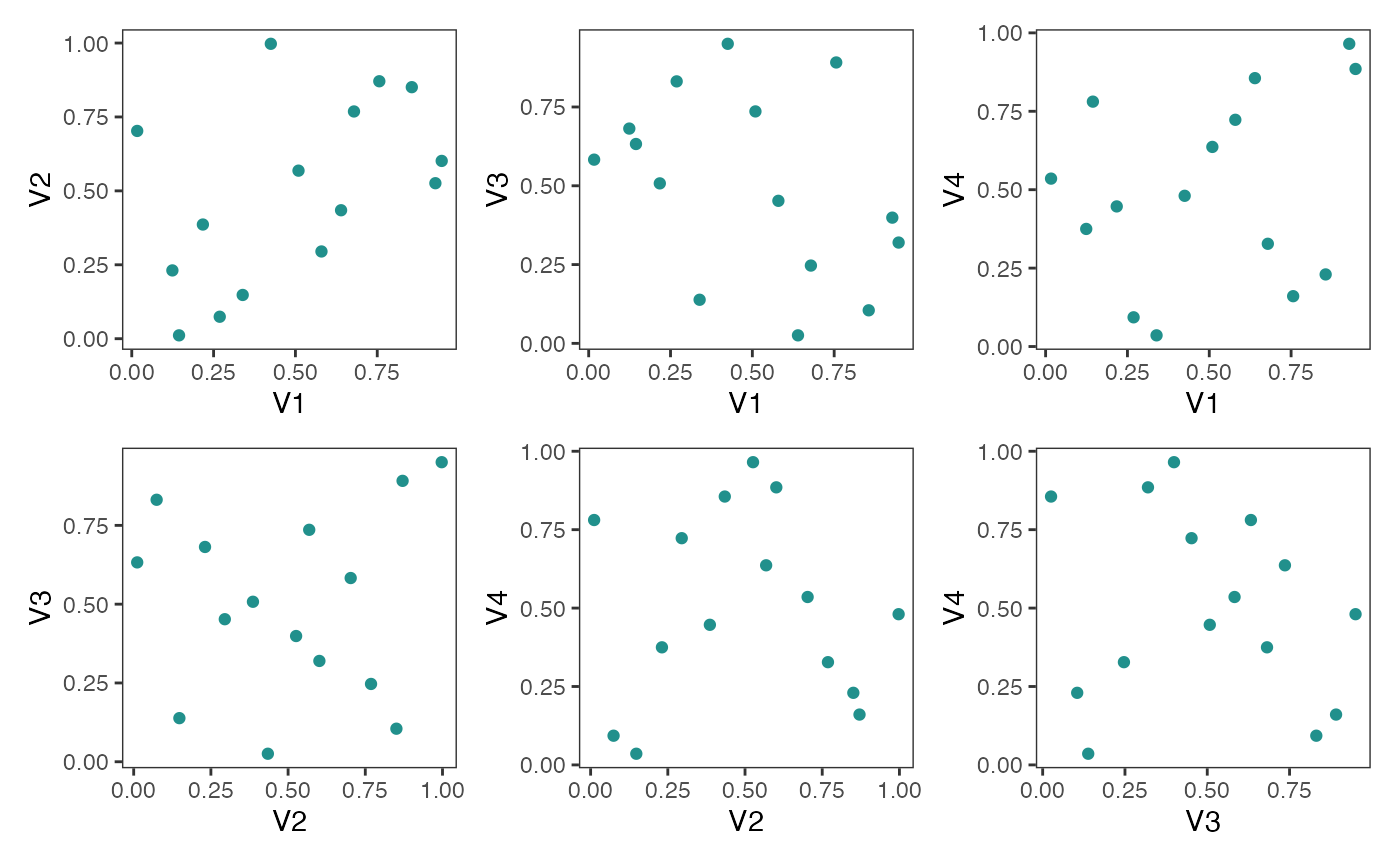
Two Dimensional Projections of Latin Hypercube Designs
Usage
pair_plots(
  design,
  point_color = "#21908CFF",
  grid = FALSE,
  point_size = 1.5,
  n_columns = 2
)
Arguments
- design
A Latin hypercube design. Can be matrix, or data.frame
- point_color
Change color of points in plots
- grid
Logial argument. Specify if a grid should be added to each projection. The grid is constructed using seq(0,1,length=nrows(design)+1). Default is FALSE
- point_size
Change size of points in plots
- n_columns
number of columns for grid layout. Default is 2